Volume Candle
See Volume on Every Bar. Instantly.
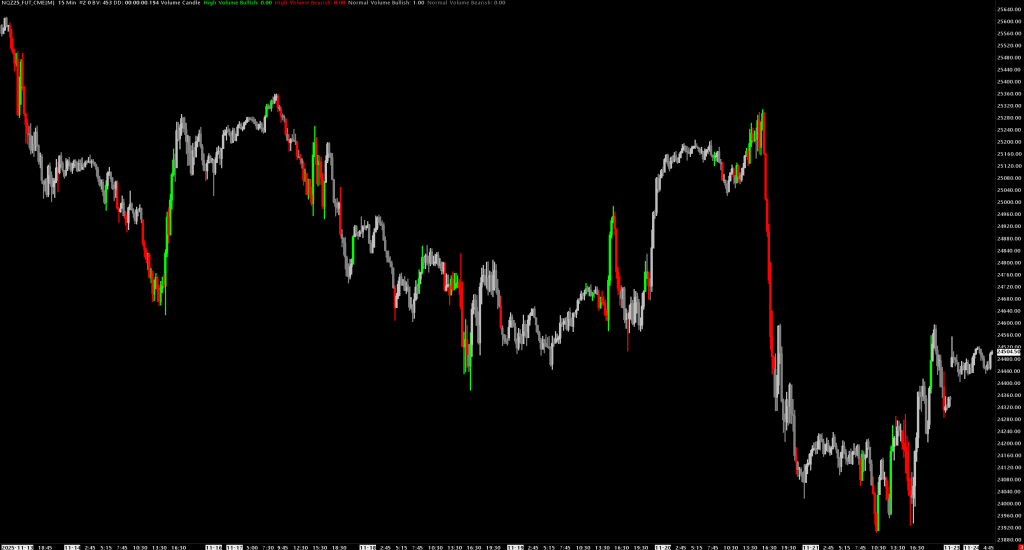
Stop glancing between price and volume charts. Volume Candle colors each bar based on volume intensity, so you know immediately which moves have conviction.
FOUR COLORS. COMPLETE PICTURE.
- Lime Green = High volume + Price up (strong buying)
- Red = High volume + Price down (strong selling)
- Silver = Normal volume + Price up (weak buying)
- Gray = Normal volume + Price down (weak selling)
HOW IT WORKS:
- Calculates volume EMA over your chosen period
- Compares each bar’s volume to the average
- Colors the bar based on volume intensity + direction
- No indicator window needed—information is on the candle itself
INSTANT ANSWERS TO:
- Is this breakout real? (Lime/Red = yes, Silver/Gray = maybe not)
- Is this trend strong? (Consistent high-volume bars = yes)
- Is this level significant? (High-volume rejection = yes)
- Is momentum shifting? (Color changes = warning sign)
CONFIGURABLE:
- Period: How many bars for volume average (default 20)
- Factor: How much above average = “high volume” (default 125%)
- Colors: Fully customizable to match your chart style
PERFECT FOR:
- Breakout traders confirming volume
- Trend traders gauging momentum
- Support/resistance traders reading conviction
- Anyone who wants volume info without extra indicators
One glance. Full context.
SHORT VERSION (for marketplaces):
Colors price bars by volume intensity and direction. High-volume bullish bars show lime green, high-volume bearish bars show red, while normal-volume bars display silver/gray. Instantly see which moves have conviction without checking a separate volume indicator. Configurable EMA period and volume threshold factor. Simple concept, powerful visual feedback.
Documentation
Colors price bars based on volume intensity and price direction, instantly highlighting high-volume moves.
Overview
Volume Candle provides immediate visual feedback by coloring each candle according to two factors:
- Volume intensity: Is volume above or below average?
- Price direction: Did the bar close up or down?
This creates four distinct candle colors that let you instantly identify which moves have conviction (high volume) and which are weak (normal volume).
How It Works
- Calculates an Exponential Moving Average (EMA) of volume
- Compares each bar’s volume to the EMA × factor threshold
- Determines if the bar closed up (bullish) or down (bearish)
- Colors the bar accordingly
Color Coding
| Condition | Default Color | Meaning |
|---|---|---|
| High Volume + Bullish | Lime Green | Strong buying – price up with heavy volume |
| High Volume + Bearish | Red | Strong selling – price down with heavy volume |
| Normal Volume + Bullish | Silver | Weak buying – price up but low conviction |
| Normal Volume + Bearish | Gray | Weak selling – price down but low conviction |
Subgraphs
| Subgraph | Description |
|---|---|
| High Volume Bullish | Colors bars with volume > threshold and close > open |
| High Volume Bearish | Colors bars with volume > threshold and close < open |
| Normal Volume Bullish | Colors bars with volume ≤ threshold and close > open |
| Normal Volume Bearish | Colors bars with volume ≤ threshold and close < open |
| Volume EMA | Internal EMA calculation (hidden) |
Inputs
| Input | Default | Description |
|---|---|---|
| Period | 20 | EMA period for volume average calculation |
| Proportion to Average | 1.25 | Volume threshold multiplier. 1.25 means volume must exceed 125% of average to be “high volume” |
Input Guidelines
Period
- Shorter (10-15): More responsive, more “high volume” bars
- Standard (20): Balanced approach
- Longer (30-50): Smoother average, only exceptional volume highlighted
Proportion to Average (Factor)
- 1.0: Volume must exceed average (50% of bars will be “high volume”)
- 1.25: Volume must exceed 125% of average (default, selective)
- 1.5: Volume must exceed 150% of average (very selective)
- 2.0: Only bars with double the average volume highlighted
Trading Applications
Breakout Confirmation
- Breakouts with lime/red bars = high conviction, likely to follow through
- Breakouts with silver/gray bars = low conviction, higher failure rate
Trend Strength
- Trends with consistent high-volume bars in trend direction = strong trend
- Trends with mostly normal-volume bars = weak trend, potential exhaustion
Reversal Signals
- High-volume bar against the trend = potential reversal
- Example: Red bar in uptrend = selling pressure emerging
Support/Resistance Tests
- High-volume rejection = strong level
- Low-volume test = weak level, likely to break
Visual Interpretation
Strong Uptrend:    [Lime] [Lime] [Silver] [Lime] [Lime]
Weak Uptrend:      [Silver] [Silver] [Gray] [Silver] [Silver]
Strong Downtrend:  [Red] [Red] [Gray] [Red] [Red]
Reversal Setup:    [Lime] [Lime] [Red] [Red] [Red]
Customization
All four colors are fully customizable via the subgraph settings:
- Right-click study > Study Settings
- Click on each subgraph
- Change Primary Color to your preference
Popular Color Schemes
High Contrast:
- High Volume Up: Bright Green
- High Volume Down: Bright Red
- Normal Volume Up: Dark Green
- Normal Volume Down: Dark Red
Monochrome:
- High Volume Up: White
- High Volume Down: White
- Normal Volume Up: Dark Gray
- Normal Volume Down: Dark Gray
Installation
- Place
VolumeCandle.dllin your Sierra ChartDatafolder - Add study to chart: Analysis > Studies > Add Custom Study
- Search for “Volume Candle”
Requirements
- Sierra Chart
- Volume data for the instrument
- Applied to main price graph (Graph Region 0)