Cumulative Imbalances
See the Imbalance Battle. As a Single Line.
Volume imbalance indicators show you where buyers or sellers dominated. But they don’t show you who’s winning overall.
Cumulative Imbalances tracks the running score:
- Buy imbalance detected → Line goes UP (+1)
- Sell imbalance detected → Line goes DOWN (-1)
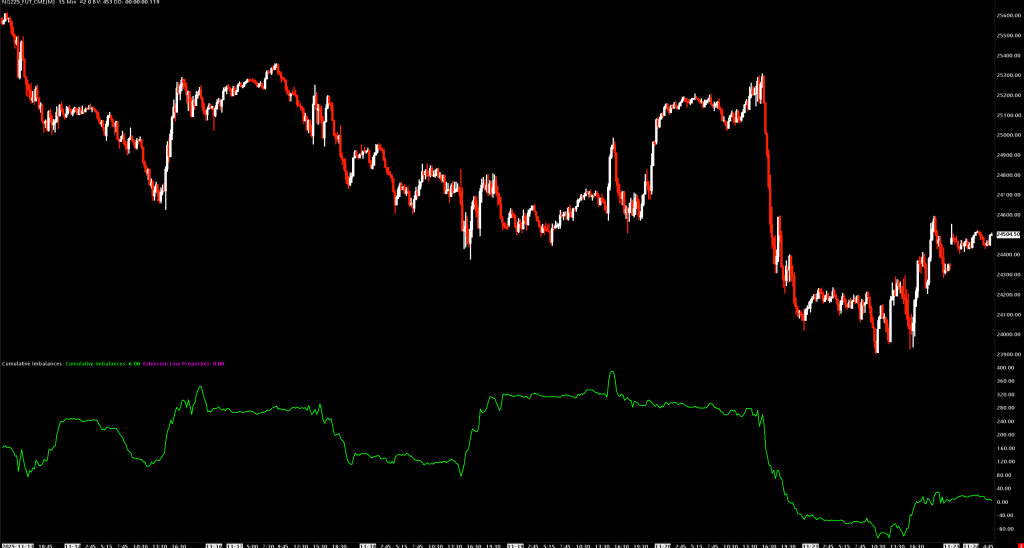
Watch the cumulative total build over time. See trends, divergences, and shifts in control—all from one clean line.
WHAT IT SHOWS:
- Rising line = Buyers winning the imbalance war
- Falling line = Sellers winning
- Divergence from price = Potential reversal signal
KEY FEATURES:
- All 9 comparison methods from VAP Threshold Alert
- Minimum volume filter for ratio comparisons (no noise)
- Separate pane display for clean analysis
- Stacked imbalance highlighting (optional)
- Extension lines for key levels (optional)
TRADING APPLICATIONS:
- Trend confirmation (trade with the line direction)
- Divergence setups (price vs cumulative disagreement)
- Session bias analysis (who’s in control today?)
- Absorption detection (sharp moves = strong hands)
PERFECT FOR:
- Orderflow traders who want cumulative context
- Divergence hunters looking for reversal signals
- Trend traders confirming directional bias
- Anyone who wants imbalance data simplified
One line. Complete picture.
Documentation
Tracks the running total of bid/ask imbalances as a line graph, showing the cumulative buying vs selling pressure over time.
Cumulative Imbalances extends the Volume At Price Threshold Alert concept by maintaining a running count of imbalances:
- When a buying imbalance is detected (ask dominance), the line moves up (+1)
- When a selling imbalance is detected (bid dominance), the line moves down (-1)
This creates a cumulative delta-style indicator specifically for imbalance events, helping you visualize whether buyers or sellers are winning the imbalance battle over time.
How It Works
- Scans each bar’s Volume at Price data
- Identifies price levels meeting your imbalance threshold
- Adds +1 for buy imbalances, -1 for sell imbalances
- Plots the cumulative total as a line graph
Key Differences from Volume At Price Threshold Alert
| Feature | VAP Threshold Alert | Cumulative Imbalances |
|---|---|---|
| Display | Markers on price chart | Line graph in separate pane |
| Output | Individual alert locations | Running total over time |
| Direction | Shows where imbalances occur | Shows net buying/selling pressure |
| Trend Analysis | Difficult | Easy – line direction shows bias |
Subgraphs
| Subgraph | Description |
|---|---|
| Cumulative Imbalances | Main line graph showing running imbalance total |
| Count of Alerts | Number of imbalances per bar (hidden by default) |
| Trigger 1-47 | Individual trigger price levels (hidden by default) |
| Adjacent Alert Highlights | For stacked imbalance highlighting |
Inputs
| Input | Default | Description |
|---|---|---|
| Comparison Method | Total Volume | Method for detecting imbalances (see below) |
| Volume Threshold | 100 | Threshold for volume-based comparisons |
| Percentage Threshold | 150% | Threshold for ratio-based comparisons |
| Minimum Volume for Ratio Comparisons | 0 | Filter out low-volume ratio signals |
| Volume Alert Number | 0 | Audio alert sound |
| Draw Extension Lines | None | Extension line options |
| Highlight Adjacent Alerts Group Size | 0 | Minimum size for stacked imbalance highlighting |
| Number of Days to Calculate | 30 | Lookback period |
Comparison Methods
- Bid Volume – Count when bid volume exceeds threshold (+1)
- Ask Volume – Count when ask volume exceeds threshold (+1)
- Total Volume – Count when total volume exceeds threshold (+1)
- Number of Trades – Count when trade count exceeds threshold (+1)
- Ask Volume Bid Volume Difference – +1 for ask dominance, -1 for bid dominance
- Ask Volume Bid Volume Diagonal Difference – Diagonal version with direction
- Ask Volume Bid Volume Ratio – +1 for ask ratio, -1 for bid ratio
- Ask Volume Bid Volume Diagonal Ratio – Diagonal ratio with direction
- Bid Volume and Ask Volume Separately – Both thresholds must be met (+1)
Interpreting the Line
Trend Direction
- Rising line: Net buying pressure (more buy imbalances)
- Falling line: Net selling pressure (more sell imbalances)
- Flat line: Balanced or no significant imbalances
Divergences
- Price up + Line down: Bearish divergence (selling into strength)
- Price down + Line up: Bullish divergence (buying into weakness)
Extreme Readings
- Sharp spikes up: Strong buying absorption
- Sharp spikes down: Strong selling absorption
Use Cases
Trend Confirmation
Align trades with the cumulative line direction:
- Long setups when line is rising
- Short setups when line is falling
Divergence Trading
Look for price/cumulative divergences at key levels for reversal setups.
Session Analysis
Reset at session start to see intraday cumulative bias.
Installation
- Place
CumulativeImbalances.dllin your Sierra ChartDatafolder - Add study to chart: Analysis > Studies > Add Custom Study
- Search for “Cumulative Imbalances”
Requirements
- Sierra Chart with Volume at Price data enabled
- Main chart must have VAP data (study displays in separate pane)