Auto Fibonacci Golden Pocket
Stop Drawing Fibs Manually. Let the Chart Do It.
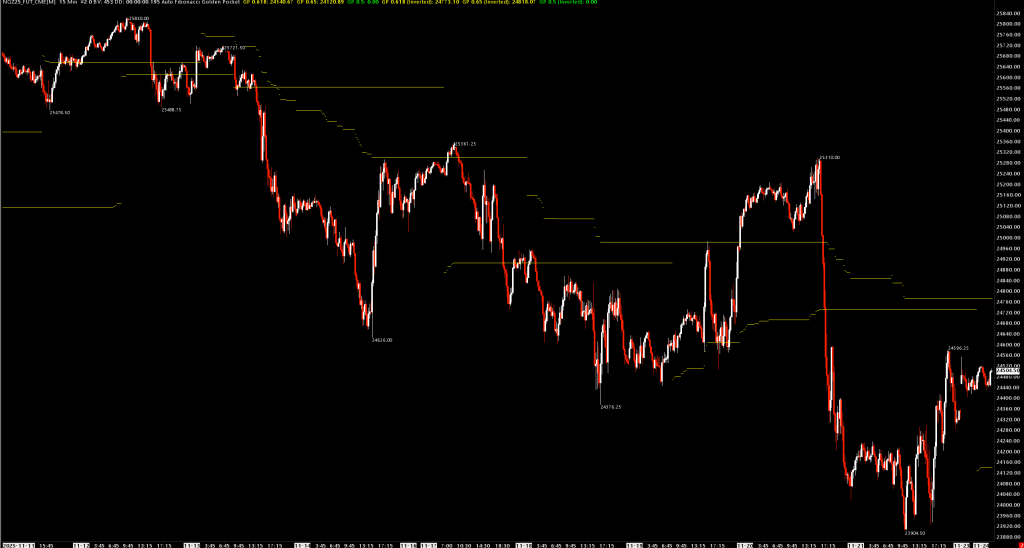
The Golden Pocket (0.618-0.65 Fibonacci zone) is where smart money enters. But manually drawing Fibonacci retracements on every swing is tedious and error-prone.
Auto Fibonacci Golden Pocket automatically:
- Detects pivot highs and lows in real-time
- Draws the Golden Pocket zone as price develops
- Updates dynamically as new swings form
- Shows both bullish and bearish setups (inverted mode)
FEATURES:
- Configurable pivot sensitivity (scalping to swing trading)
- Optional 50% level display
- Pivot price labels for quick reference
- Clean, minimal chart clutter
PERFECT FOR:
- Fibonacci traders who want automation
- Pullback/retracement entry strategies
- Identifying high-probability reversal zones
- Traders who value clean, hands-free charting
Set it once. Trade the pocket.
Automatically draws Fibonacci Golden Pocket retracement levels based on dynamically detected pivot highs and lows.
Documentation
Overview
The Golden Pocket is the zone between the 0.618 and 0.65 Fibonacci retracement levels—a key area where price frequently reverses. This study automatically identifies swing highs and lows and draws the Golden Pocket zone in real-time, eliminating the need to manually draw Fibonacci retracements.
How It Works
- Pivot Detection: The study identifies pivot highs and lows using a configurable lookback period
- Dynamic Updates: As new pivots form, the Golden Pocket levels automatically update
- Bi-directional: Shows both bullish (retracement from low) and bearish (retracement from high) setups
Subgraphs
| Subgraph | Description |
|---|---|
| GP 0.618 | Upper boundary of Golden Pocket (bullish retracement) |
| GP 0.65 | Lower boundary of Golden Pocket (bullish retracement) |
| GP 0.5 | 50% retracement level (optional) |
| GP 0.618 (Inverted) | Lower boundary of inverted Golden Pocket (bearish retracement) |
| GP 0.65 (Inverted) | Upper boundary of inverted Golden Pocket (bearish retracement) |
| GP 0.5 (Inverted) | Inverted 50% level (optional) |
Inputs
| Input | Default | Description |
|---|---|---|
| Pivot Length | 50 | Number of bars on each side to confirm a pivot. Higher = fewer, more significant pivots |
| Show Inverted | No | Display the inverted (bearish) Golden Pocket levels |
| Show 0.5 Level | No | Display the 50% retracement level in addition to the Golden Pocket |
| Draw Pivot Point Labels | Yes | Show price labels at detected pivot points |
Use Cases
Pullback Entries
- Wait for price to retrace into the Golden Pocket zone (0.618-0.65)
- Look for confirmation (candlestick patterns, volume, etc.) within the zone
- Enter with stop below the swing low (for longs) or above swing high (for shorts)
Trend Continuation
- In uptrends, the bullish Golden Pocket acts as support
- In downtrends, enable “Show Inverted” to see resistance zones
Multi-Timeframe Analysis
- Apply to higher timeframes to identify key levels
- Use lower timeframes to fine-tune entries within the zone
Pivot Length Guidelines
| Market Type | Suggested Length |
|---|---|
| Scalping (1-5 min) | 10-20 |
| Day Trading (5-15 min) | 20-50 |
| Swing Trading (1H-4H) | 50-100 |
| Position Trading (Daily) | 50-200 |
Installation
- Place
AutoFibonacciGoldenPocket.dllin your Sierra ChartDatafolder - Add study to chart: Analysis > Studies > Add Custom Study
- Search for “Auto Fibonacci Golden Pocket”
Requirements
- Sierra Chart
- Must be applied to main price graph (Graph Region 0)