
VPIN — Volume-Synchronized Probability of Informed Trading
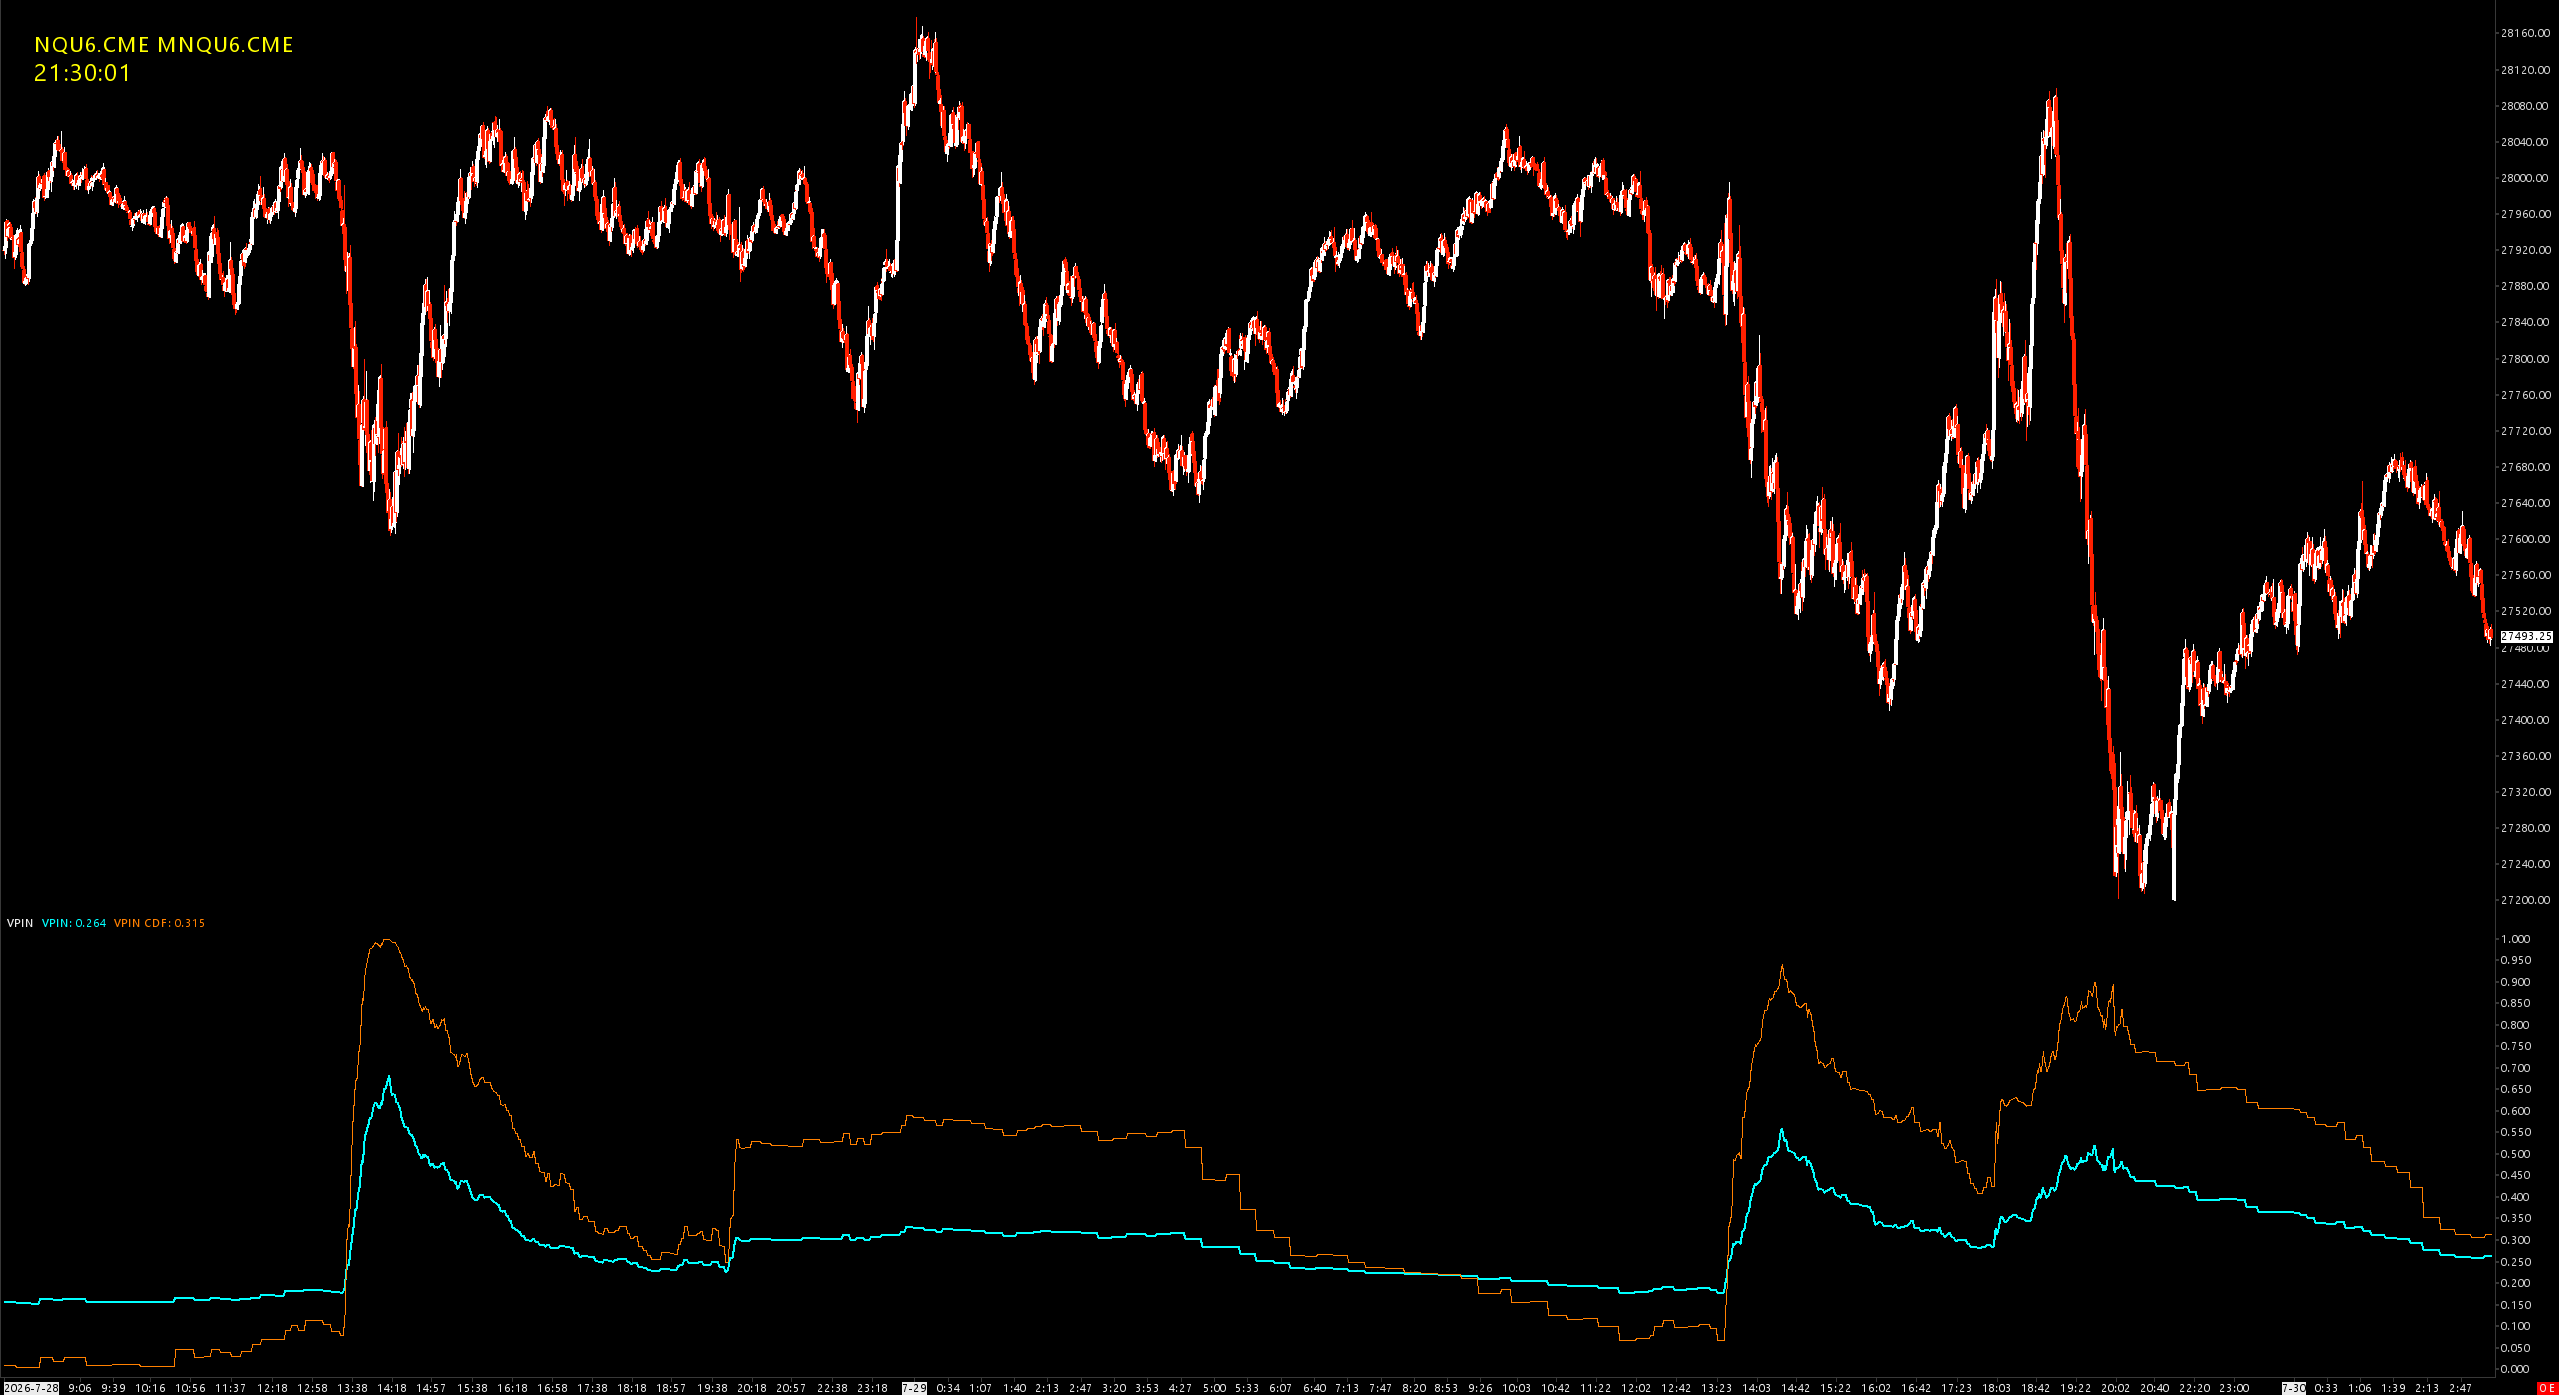
Measures order flow toxicity: how one-sided recent trading volume is, and how extreme that is relative to the instrument's own recent history.
Overview
VPIN (Easley, López de Prado & O'Hara — "Flow Toxicity and Liquidity in a High Frequency World", Review of Financial Studies 2012) estimates the probability that current order flow is coming from informed/urgent traders rather than balanced two-way business. Persistent one-sided flow is "toxic" to liquidity providers: they widen spreads or pull quotes, which precedes thinner books and higher short-term volatility. VPIN on the E-mini S&P was famously elevated for hours before the May 2010 Flash Crash.
The study computes VPIN in volume time: trading is divided into equal-volume buckets, so busy periods produce many buckets and quiet periods few, keeping the measure comparable across the session.
How It Works
- Volume bucketing. Bar volume is poured sequentially into buckets of fixed size V (bars are split across bucket boundaries). Bucket size is set explicitly or derived automatically as average daily volume / buckets per day.
- Buy/sell classification. Each bar's volume is classified either by Bulk Volume Classification —
VBuy = V × Z(ΔP/σ)withZthe standard normal CDF and σ the rolling std deviation of bar-to-bar price changes — or directly from actual Ask/Bid traded volume. - VPIN = mean of
|VBuy − VSell| / Vover the last n completed buckets. Ranges 0 (perfectly balanced) to 1 (fully one-sided). It is direction-agnostic: it rises whether the pressure is buying or selling. - VPIN CDF ranks the current VPIN within its trailing history — the fraction of recent VPIN values at or below the current one. This is the recommended way to read toxicity: raw VPIN levels are not comparable across symbols or regimes, ranks are.
Subgraphs
| Subgraph | Description |
|---|---|
| VPIN | The raw toxicity estimate (0–1) |
| VPIN CDF | Rank of current VPIN within the trailing lookback (0–1) |
Inputs
| Input | Default | Description |
|---|---|---|
| Volume Bucket Size | 0 (auto) | Contracts per bucket; 0 derives it from average daily volume / Buckets Per Day |
| Buckets Per Day | 50 | Used for the automatic bucket size |
| Sample Length (buckets) | 50 | Buckets averaged into VPIN |
| Volume Classification | Bulk Volume Classification | BVC (normal CDF of price change) or Actual Ask/Bid Volume |
| Sigma Lookback (bars) | 250 | Rolling window for the BVC price-change std deviation |
| VPIN CDF Lookback (buckets) | 500 | Trailing window the CDF ranks against |
Reading It
- CDF ≈ 0.5 — order flow imbalance is typical; nothing unusual.
- CDF > 0.9 — current toxicity is higher than 90% of the lookback: expect wider spreads, faster directional moves, worse fill quality. Favor momentum over fading; widen stops.
- CDF pinned near 1.0 — flow about as one-sided as it gets for this instrument; historically clusters around liquidity events and volatility expansions.
VPIN is a regime gauge, not an entry trigger: it is a moving average over many buckets and moves in slow waves. Expect the CDF to hold elevated for stretches rather than spike and revert.
Recommended Settings
Paper-faithful (slow, daily regime): the defaults — 50 buckets/day, sample 50 (VPIN window = one full day of volume), 1-minute chart, 24-hour session.
Intraday (ES and similar):
| Input | Value | Effect |
|---|---|---|
| Buckets Per Day | 200 | A bucket completes every ~2–3 min in RTH |
| Sample Length | 30 | VPIN reflects the last ~60–90 min of flow |
| VPIN CDF Lookback | 10000 | ~10 trading weeks of reference, so one volatile week can't pin the CDF |
| Days to Load | 60–90 | The CDF window must be rebuildable from loaded chart data |
Keep Sample Length ≥ ~20 — below that VPIN gets jumpy and the CDF flickers instead of holding.
Classification choice: BVC is the paper's choice and generally tracks toxicity better on index futures — its probabilistic smearing filters the two-way HFT churn that exact aggressor-side classification lets through. With Sierra you have both; comparing them on your instrument is one click.
Notes
- Use a 24-hour session chart: buckets fill slowly overnight (volume time working as intended), so the indicator appears frozen in quiet Globex hours and updates at trading pace in RTH.
- By construction only ~10% of buckets rank above 0.9 over a long run — but they arrive in blocks, not scattered. That persistence is a property of the measure, not a malfunction.
- With Actual Ask/Bid classification on a chart without bid/ask volume data, every bar classifies neutral and VPIN stays at 0; the study logs a message telling you to switch to BVC.
Installation
- Place
VPIN.dllin your Sierra ChartDatafolder - Add study to chart: Analysis > Studies > Add Custom Study
- Search for "VPIN"
Requirements
- Sierra Chart with intraday volume data (1-minute chart recommended)
- Bid/ask volume data only if using Actual Ask/Bid classification