Forex Factory Events
Polls the ForexFactory weekly economic calendar JSON feed and draws a styleable vertical line at every event's scheduled time, with an optional rotated text label.
Overview
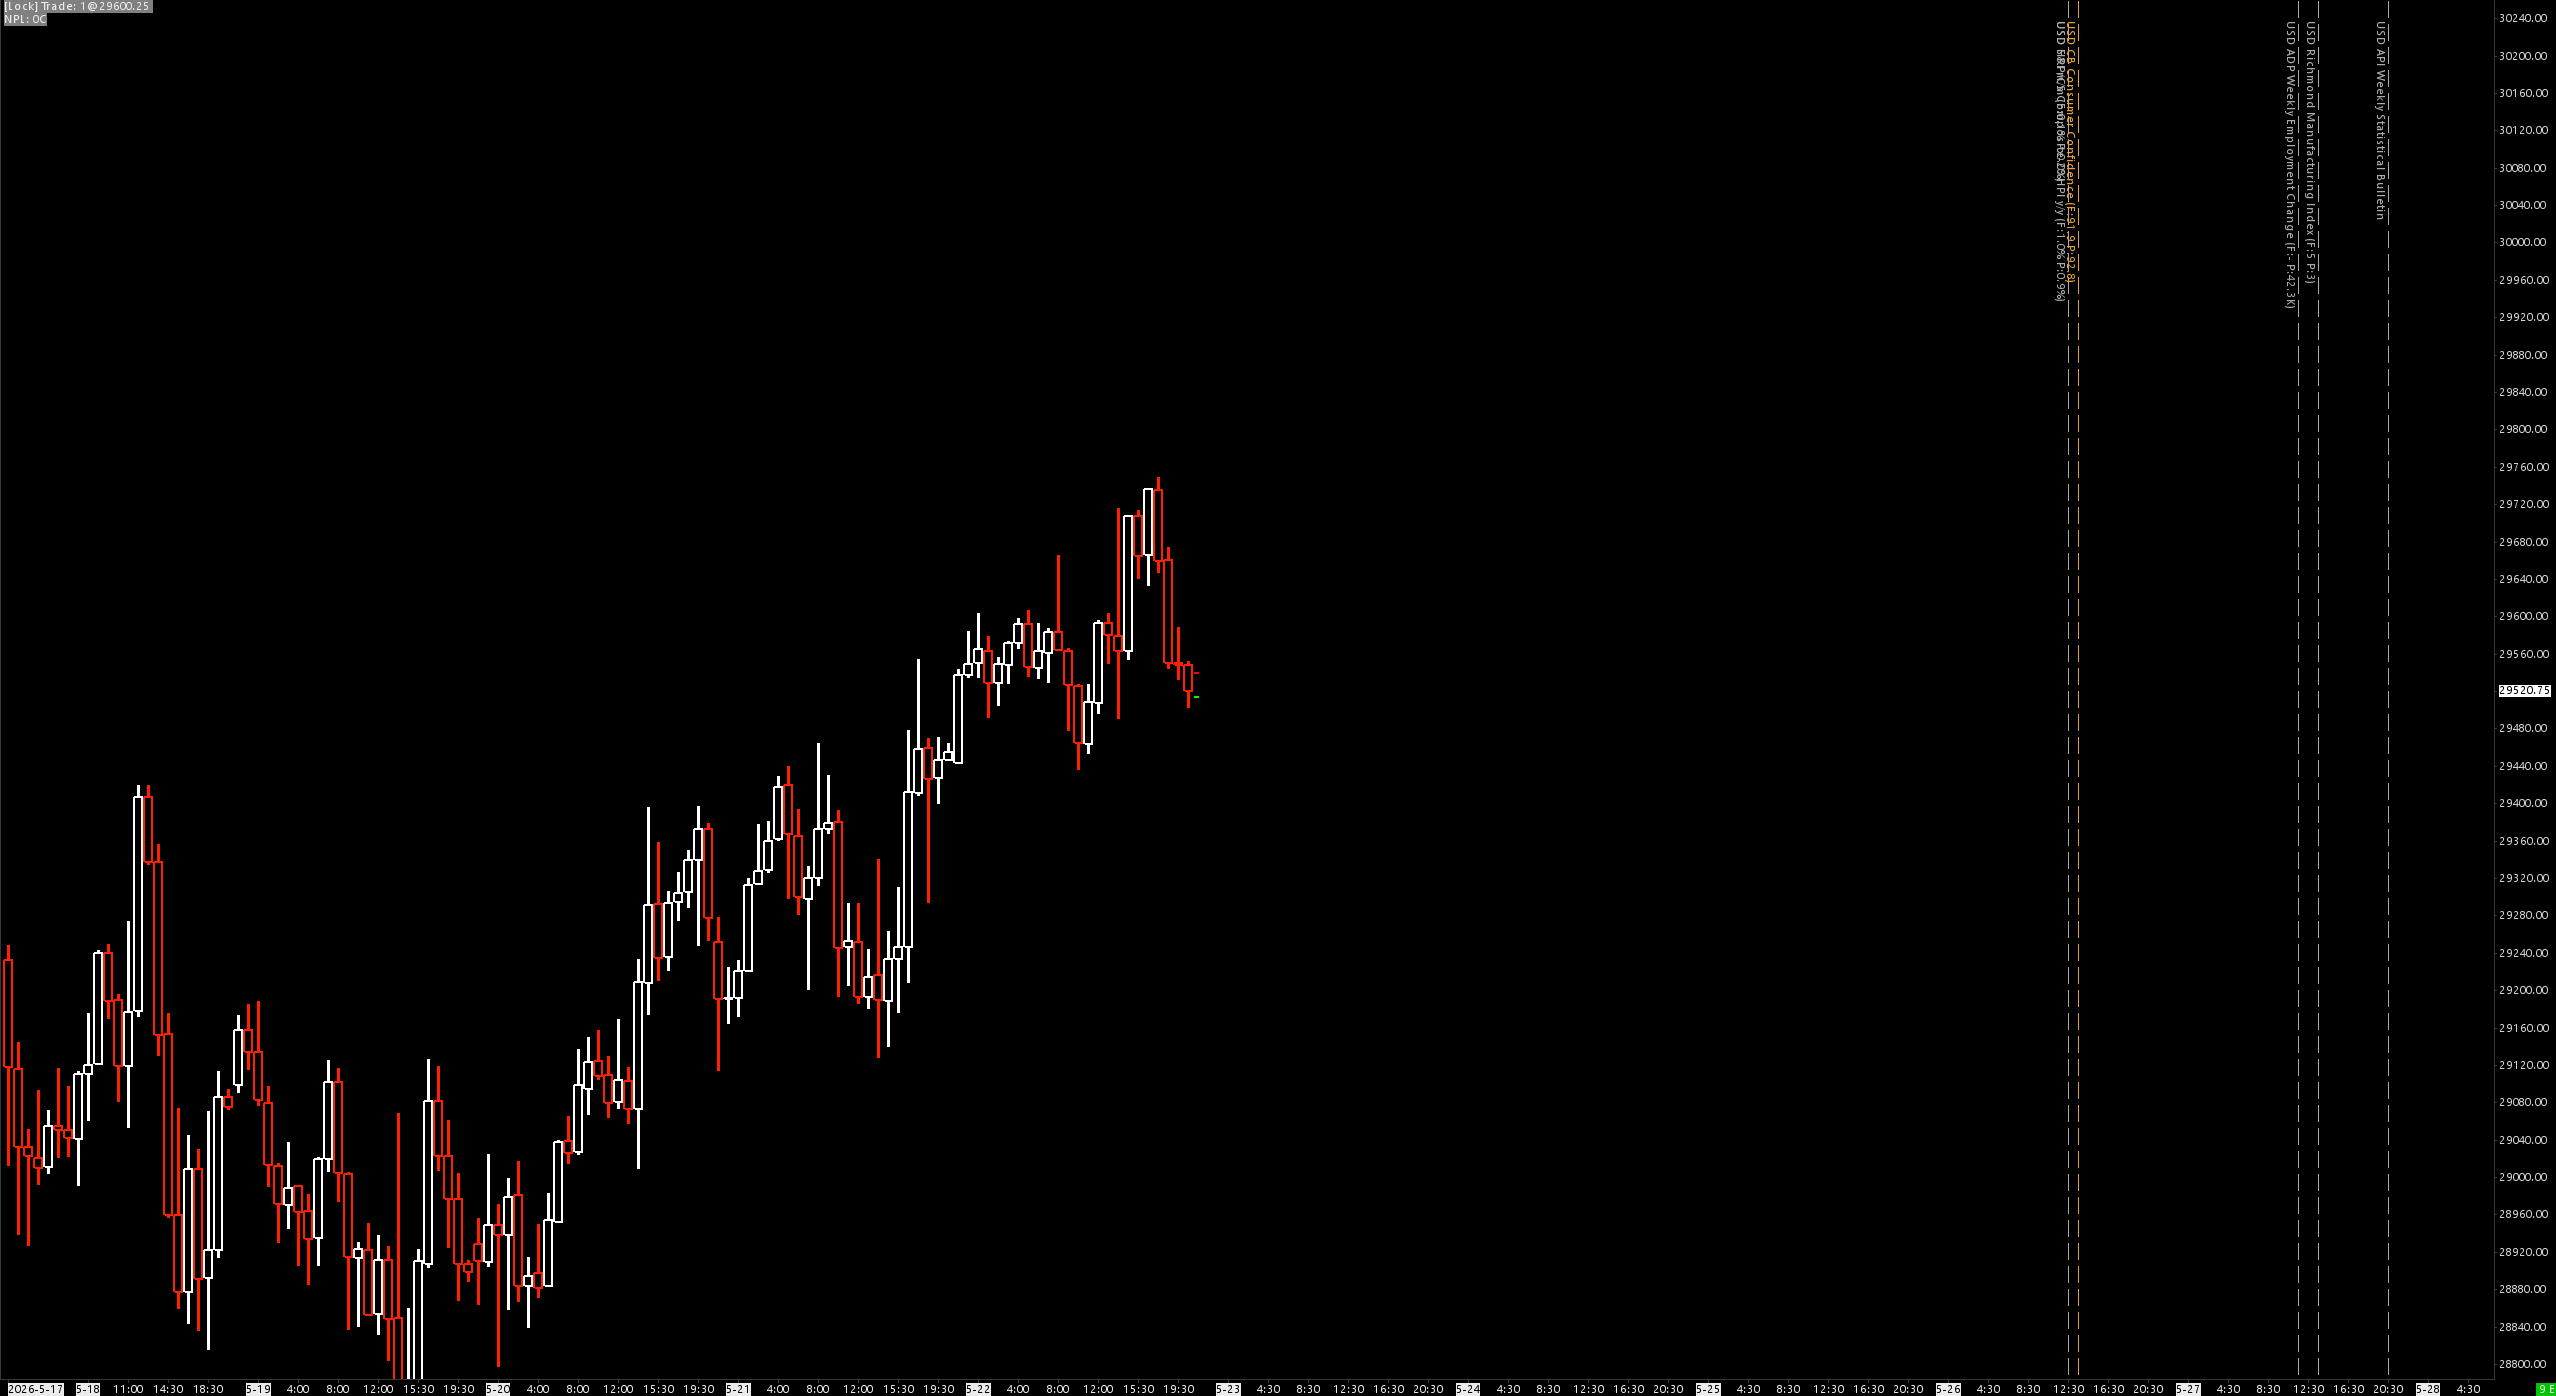
Economic releases (CPI, NFP, FOMC, GDP, central-bank rate decisions, etc.) drive volatility windows on index futures, FX, and metals. This study fetches the official ForexFactory "this week" JSON, parses every event, and renders each one on the chart as a vertical line so you can see at a glance where the high-impact prints land in your chart timezone.
Default source: https://nfs.faireconomy.media/ff_calendar_thisweek.json — the same feed used by the public ForexFactory calendar page.
How It Works
- HTTP poll — issues an HTTPS request to the JSON URL on study load and every Poll Interval minutes thereafter (default 60).
- JSON parse — flat scan of the response extracts title, country, date, impact, forecast, previous for every event in the array.
- Timezone normalization — each event timestamp carries its own offset (publisher ships NY local time). Parser converts to UTC, then shifts to the chart's configured timezone. Lines render at the correct wall-clock instant regardless of chart TZ.
- Filter — events run through impact, currency, title-include, title-exclude, and chart-time window filters.
- Draw — surviving events get a vertical line with optional rotated text label. Drawings never save to the chartbook.
Data Fields
The ForexFactory JSON ships flat objects with these fields:
| Field | Type | Values |
|---|---|---|
title | string | Event name, e.g. "CPI y/y", "Non-Farm Employment Change" |
country | string | USD, EUR, GBP, JPY, AUD, NZD, CAD, CHF, CNY |
date | string | ISO 8601 with timezone offset, e.g. 2026-05-26T21:30:00-04:00 |
impact | string | High, Medium, Low, Holiday |
forecast | string | Consensus value (may be empty) |
previous | string | Prior reading (may be empty) |
Inputs
| # | Input | Default | Description |
|---|---|---|---|
| 0 | Calendar JSON URL | https://nfs.faireconomy.media/ff_calendar_thisweek.json | Source feed URL |
| 1 | Poll Interval (Minutes) | 60 | How often to re-fetch the JSON |
| 2 | Show: High Impact | Yes | Draw High-impact events |
| 3 | Show: Medium Impact | Yes | Draw Medium-impact events |
| 4 | Show: Low Impact | No | Draw Low-impact events |
| 5 | Show: Holiday | No | Draw bank holiday markers |
| 6 | Currencies (CSV) | USD | Comma-separated currency codes. Blank = all |
| 7 | Title Include Keywords (CSV) | (empty) | Only draw events whose title contains any of these substrings (case-insensitive). Blank = no include filter |
| 8 | Title Exclude Keywords (CSV) | Speaks,Bank Holiday | Skip events whose title contains any of these substrings |
| 9 | High Impact Color | Red (220, 60, 60) | Vertical line + label color for High events |
| 10 | Medium Impact Color | Amber (230, 160, 50) | Color for Medium events |
| 11 | Low Impact Color | Grey (170, 170, 170) | Color for Low events |
| 12 | Holiday Color | Blue (100, 140, 200) | Color for Holiday events |
| 13 | High Impact Line Width | 2 | Pixel width for High lines |
| 14 | Medium Impact Line Width | 1 | Pixel width for Medium lines |
| 15 | Low Impact Line Width | 1 | Pixel width for Low lines |
| 16 | Holiday Line Width | 1 | Pixel width for Holiday lines |
| 17 | Line Style | 1 (Dash) | 0=Solid 1=Dash 2=Dot 3=DashDot 4=DashDotDot |
| 18 | Transparency Level | 40 | 0=opaque, 100=invisible |
| 19 | Show Event Labels | Yes | Render text label alongside line |
| 20 | Label Font Size | 8 | Label text size |
| 21 | Label: Include Currency | Yes | Prefix label with currency code |
| 22 | Label: Include Impact Tag | No | Prefix label with [H]/[M]/[L]/[X] |
| 23 | Label: Include Forecast/Previous | No | Append (F:... P:...) to label |
| 24 | Label Vertical Position | 0 (Top) | 0=Top of visible range, 1=Middle, 2=Bottom |
| 25 | Label: Vertical (Rotated) Text | Yes | Rotate label 90° so it reads along the line |
| 26 | Use Chart-Time Window Filter | No | Restrict drawing to a time-of-day window |
| 27 | Window Start | 00:00:00 | Chart-time start of allowed window |
| 28 | Window End | 23:59:59 | Chart-time end of allowed window |
| 29 | Verbose Logging | No | Extra debug output |
Filter Logic
For each event, all of the following must pass:
- Impact — its impact level must have its Show toggle = Yes.
- Currency — if the Currencies CSV is non-empty, the event's
countrymust be in the list. - Title include — if the include keyword CSV is non-empty, the title must contain at least one keyword (case-insensitive substring match).
- Title exclude — title must not contain any exclude keyword.
- Time window — if enabled, the event's chart-time-of-day must be inside
[WindowStart, WindowEnd]. Overnight wrap (e.g. 22:00–06:00) supported.
Displaying Future Events
Sierra Chart clips drawings to the loaded bar range. ForexFactory ships events for the entire current week, so future events render correctly only if the chart has enough forward bars.
Chart Settings → Display → "Number of Bars to Add to End of Chart":
| Chart Period | Bars to add for ~1 week forward |
|---|---|
| 1 Min | ~10,000 |
| 5 Min | ~2,000 |
| 15 Min | ~700 |
| 1 Hour | ~170 |
| Daily | ~10 |
Without enough forward bars, all future events stack at the rightmost X position. Past events always render correctly.
Timezone Handling
The study converts every event time through UTC and out to the chart's configured timezone. Examples for 2026-05-26T21:30:00-04:00:
| Chart TZ | Line drawn at |
|---|---|
| New York (EDT) | 2026-05-26 21:30 |
| Chicago (CDT) | 2026-05-26 20:30 |
| London (BST) | 2026-05-27 02:30 |
| Tokyo (JST) | 2026-05-27 10:30 |
| UTC | 2026-05-27 01:30 |
ISO-8601 Z / z suffix and +HH:MM / -HH:MM offsets all parsed correctly. DST transitions are handled because the publisher updates the offset twice a year.
Installation
- Place
ForexFactory_64.dllin your Sierra ChartDatafolder - Add study to chart: Analysis > Studies > Add Custom Study
- Search for "Forex Factory Events"
- Set chart's Display → Number of Bars to Add to End of Chart high enough for your bar period so future events render correctly.
Requirements
- Sierra Chart with internet access for HTTPS calls
- ForexFactory JSON feed reachable (publicly hosted by FairEconomy)
- Chart must be in Graph Region 0 (overlay on price)